As part of the Brackenridge Park Conservancy’s continuing partnership with Trinity University, 52 marketing students designed and conducted a research study about Park users.
During the Spring 2019 semester, these students received 406 responses from Park users from March to May 2019. Using observational research to profile the Park’s users, they gathered data on demographics, motivations of Park users, and facilities they use.
Here are their conclusions:
Data Collection
-
How big is the party size of users?
- Median: 3 people
- Mean: 4.4 people
-
Type of party:
- Family with children: 49.5 percent
- Couples: 16.3 percent
- Group of friends: 13.3 percent
-
How much time did users spend in the Park:
- Less than an hour: 22.2 percent
- 1-3 hours: 53.2 percent
- More than three hours: 24.6 percent
-
How old are they?
- 18-25: 27.1 percent
- 26-35: 26.8 percent
- 36-45: 26.1 percent
- 46-55: 10.1 percent
- 55-65: 7.9 percent
- Over 65: 2.0 percent
-
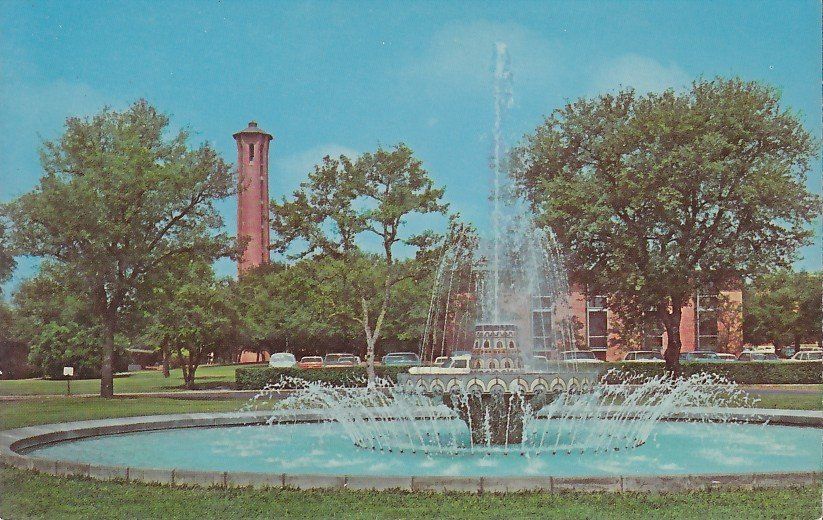
What facilities are they using:
- Japanese Tea Garden: 34.5 percent
- Open green space: 30.8 percent
- Zoo: 25.9 percent
- Walking trails: 16.7 percent
User analysis
-
Who’s here:
- Dogs
- Families with children and pre-teens (including multi-generational)
- Mothers with children
- Physically active adults
- Older people
- White and Hispanics
- Homeless
-
Who’s missing:
- Young adults (college students)
- Adult couples (retirees, DINKs)
- Young professionals
- Asian and African Americans